|
|
 | |
COMMUNITY DASHBOARD | | |
| |
|
|
IN THE NEWS |
| Local Feature Story
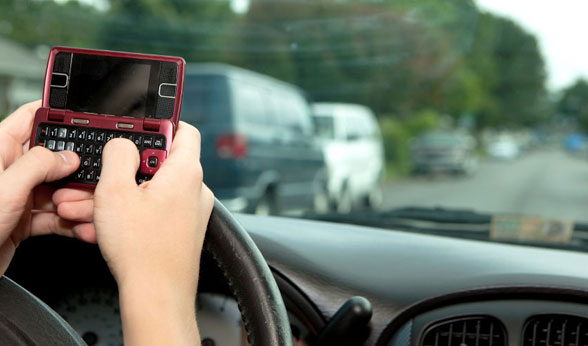
Government Debates Crackdown on In-Car Phone Use
Cell phone use while driving increases the chance of crashing, according to a recent study, prompting companies, safety groups and the U.S. government debate a crackdown on gadget use behind the wheel. The Governors Highway Safety Association, or GHSA, which studied more than 350 scientific papers about the connection between cell phone use and car crashes, found a link between texting and higher risks while driving, but remained inconclusive on how to act, suggesting states conduct their own research before banning phone use while driving. "States that have not already passed handheld bans should wait until more definitive research and data are available on these laws' effectiveness," the study concluded. "There is no evidence that cell phone or texting bans have reduced crashes."...
Read the full story
|
About This Site

Northeast Florida Counts is a one-stop source of population data and information about community health and healthy communities in general. It is intended to help planners, policy makers, and community members learn about issues and identify improvements. We invite you to use the site as a tool for community assessment, strategic planning, collaboration, community capacity development, grant development, and advocacy.
Get started on Northeast Florida Counts!
- Compare Baker, Clay, Duval, Flagler, Nassau, St. Johns, and Volusia Counties health with other Florida counties, the nation, and national targets (Healthy People 2020; University of Wisconsin / Robert Wood Johnson’s County Health Profiles) using more than 175 health and community sustainability indicators
- Northeast Florida Counts meets the new IRS 990 requirements for non-profit / charitable hospitals
- Learn about promising practices on a variety of topics that affect community health
- Submit a promising practice
- Use the Report Assistant to create quick reports and summaries
If you are interested in participating in the Northeast Florida Counts project, please contact us at 904-723-2162 ext. 144
|
| |
| |
|
|
|
| Beach Water Quality |
Select a county to view beach water quality:
Data provided by the Florida Department of Health.
|
| Walk Score |
Enter address or zip code to get your Walk Score:
|
|

 Indicator Comparison